Liquefied Natural Gas (LNG)
The LNG Status in Iran and the World; A Timeline
In this article, an overall quick look is being cast on the LNG industry, particularly in these four categories of the industry: LNG technology, LNG timeline, LNG tanker history, LNG terminals.
LNG is liquified natural gas, obtained by cooling natural gas at atmospheric pressure and -161 Celsius temperature, converted to a scent-free liquid, transparent and non-toxic with a density around 450 kg/cubic meters. As its overall volume is decreased to one sixth of its gaseous state, LNG’s transportation becomes cost-efficient. On the other hand, if leaked out of the capsule, it evaporates instantly and is displayed as a cloud of steam.
LNG’s combustibility and ignition is trivially low compared to other hydrocarbon products like LPG and natural gas, and its explosion possibility is trivial due to the cold-state and speed of ignition of this material.
Despite having one of the largest reserves of natural gas in the world, Iran is deprived of the production and exportation of LNG. The attempts of the Petroleum Ministry of Iran have been unsuccessful during the last three decades. Producing and transporting requires advanced technologies; whether to produce it under special cooling conditions or transporting it inside special large tankers to various regions of the world.
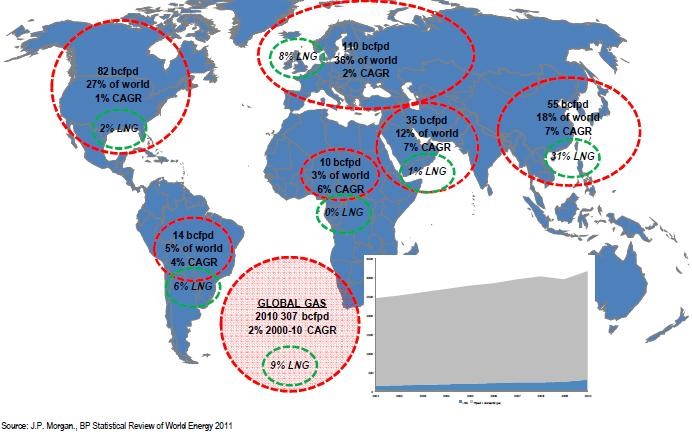
According to the annual energy statistics of BP corporation, the LNG exports in 2010 were around 320,400,000 (cubic meters). Due to the world demands for LNG , this number increased and in 2020 reached 9/487 million (cubic meters). The year 2017 was the major year of changes in LNG exports and demands worldwide, facilitated mainly by the newly-constructed plants for LNG production and transportation in different countries and proper infrastructure for this purpose, attaining this increase trend since 2017 onwards.
In the year 2020, USA (4/61), Russia (4/40), Qatar (1/106), Australia (2/106), Malaysia (8/32) (cubic meters) were the major exporters of LNG internationally. According to these statistical sources, in 2020, the largest volume of importation belonged to Asia-Pacific countries: Japan, China, South Korea and India. Japan (105), China (94), South Korea (55), India (35) (billion cubic meters) importing LNG into their countries on a yearly basis. The total import-volume of LNG around the globe in the year 2020 was approximately 488 billion cubic meters of which 345 billion belongs to the Asia-Pacific region. Also, according to BP statistics, Europe imported 115 billion cubic meters of LNG in the same year.
In the last ten years, with countries struggling to decrease the pollution and emissions resulting from fossil-fuel consumption, deploying LNG has become an expanding trend as the fuel used for ships, heavy-duty automobiles and railway transportation. The world demand for LNG will be 700 million tonnes around the globe by the year 2040, of which 70% will go to Asia.
Moreover, the distribution and regional locations of natural gas resources, and the remoteness of reserves from consumers and major markets , exporting LNG to those markets is more economical, globally, as the experts believe till the year 2035 LNG trade will surpass the international pipeline trade of natural gas.
Having the 2nd largest reserves of the world, Iran has no proper major share in the trade-market of natural gas and LNG yet. Presently, although the gas pipelines are transferring natural gas from Iran to neighbouring countries, it is not quite adequate and has to be accompanied with LNG export.
Contrary to oil and its petrochemicals, one of the LNG industry advantages, is that we are no longer confined to particular markets. For example,, gas pipelines are for specific destination and countries, whereas LNG can be transferred to any region of the world in tankers quickly and easily in a liquid form. This helps us approach any market and region of the world.
The attempts of Iran to enter the LNG market and trade began before the revolution. In 1978 (1357) some attempts were made to set up Iran’s first LNG plant in Bushehr province, named ”KALINGAS“. Its annual capacity and production was estimated to be 3 million tonnes, with tankers holding a capacity of 130,000 cubic meters of LNG for transportation to various destinations. After the revolution, this project was halted. Iran didn’t retrieve onto the LNG industry and technology till the 1380s. In this decade, three LNG projects were initiated by the petroleum ministry of Iran: Iran LNG, Persian LNG, Pars LNG (in Asalouyeh, Bushehr province), with the collaboration of Germany, the Netherlands, and France.
Out of these 3 projects, only Iran LNG has been less than 50% completed so far, and the other two were halted. In Iran LNG project, instead of opting for the license and the technology, the utility was constructed Initially, meaning they firstly constructed the electricity power-plant as well as the related secondary equipment and sites. Therefore a long way is still due for the completion of the project.
LNG Technology
LNG is a clear, colourless and non-toxic liquid which is formed when natural gas is cooled down to -162° Celsius (-260° Fahrenheit). The cooling process shrinks the volume of gas 600 times, making it easier and safer to store and ship. In its liquid state, LNG will not ignite.
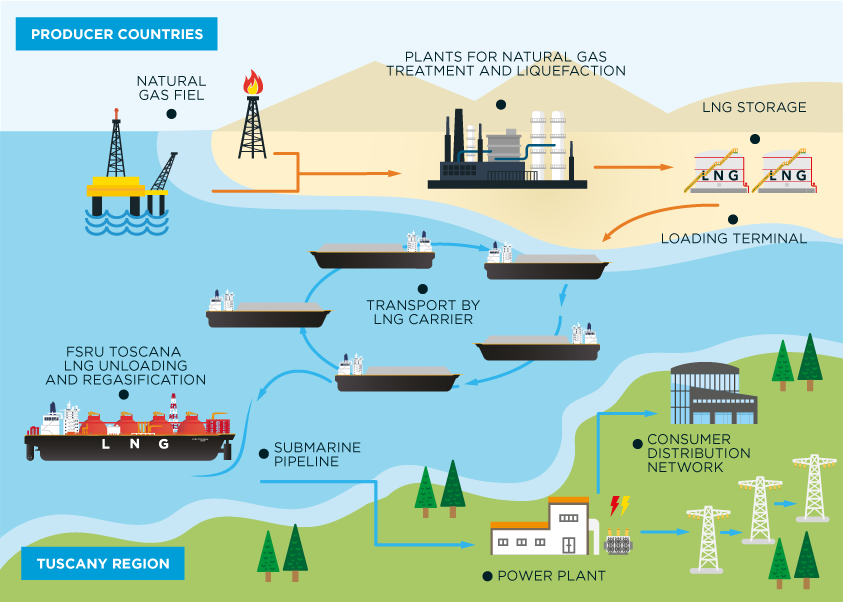
When LNG reaches its destination, it is turned back into gas at regasification plants. It is then piped to homes, businesses and industries where it is burnt for heat or electricity generation. LNG is now also emerging as a cost-competitive and cleaner transport fuel, especially for shipping and heavy-duty road transport.
Multiple layers of protection at LNG facilities are designed to reduce the risk of incidents: for example, minimising any confined spaces where LNG vapour could accumulate and removing ignition sources.
LNG is produced from natural gas in the liquefaction process. Liquefaction or condensation is a phenomenon that changes the aggregate state, when a substance passes from the gas phase into the liquid phase. This can take place under certain pressures and at a temperature below the critical temperature of the surroundings. Condensation is connected with reducing the distance among the molecules of a given substance. The drop in temperature makes the molecules move slower. The forces acting among them increase until they reach their new state of equilibrium. Heat energy is given out in this process. The liquefaction process takes place in a different manner when the gas contains impurities.
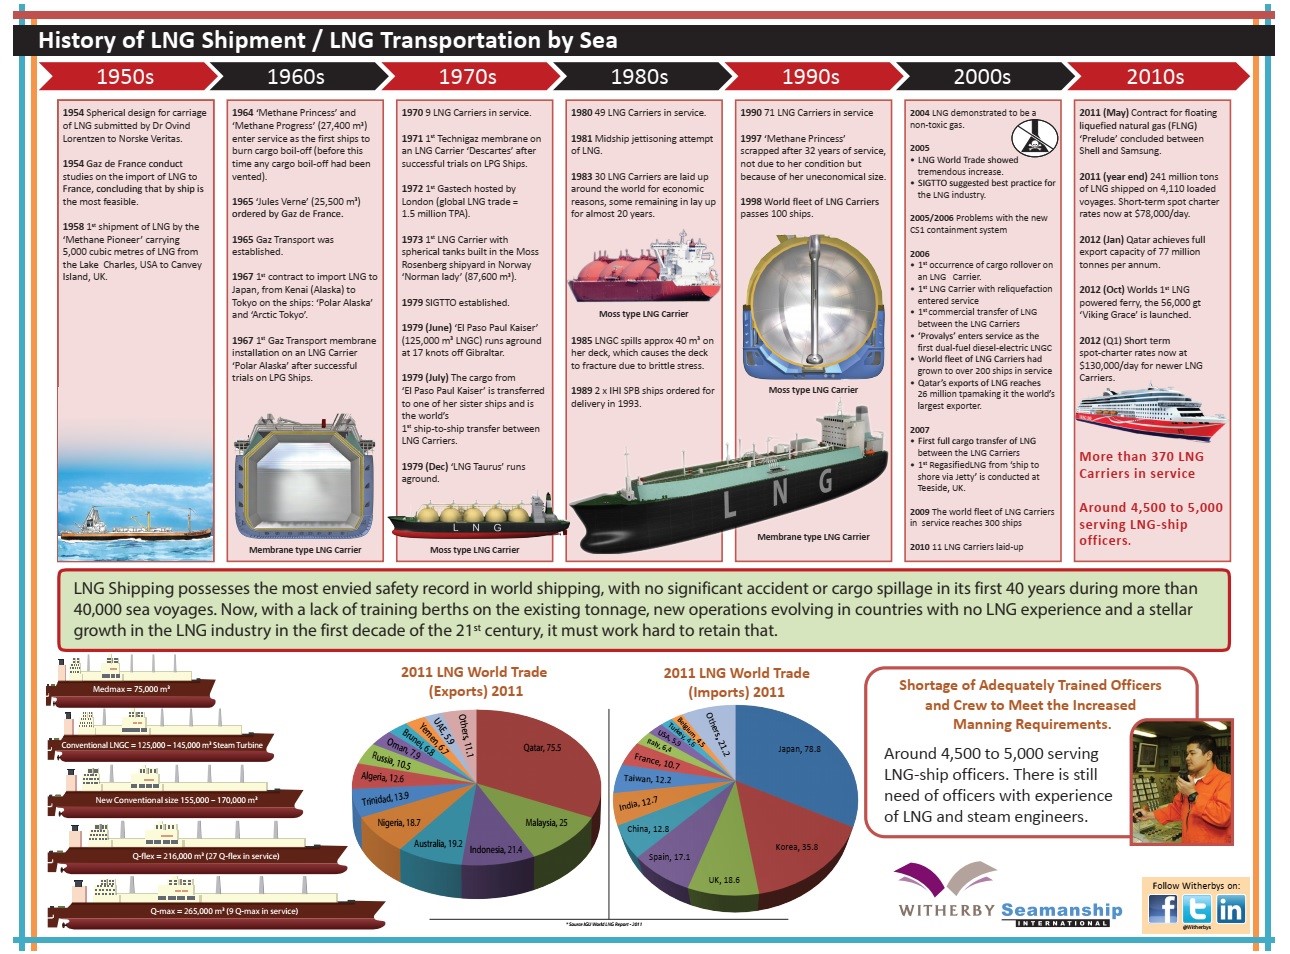
LNG is rapidly playing a bigger role in the energy mix. LNG trade increased from 100 million tonnes in 2000 to nearly 300 million tonnes in 2017. To provide you with a perspective, it is interesting to mention that only 80,000 tonnes of LNG were shipped by two carriers in 1964, the first year of the LNG trade.
The Floating Liquefied Natural Gas (FLNG)
According to the International Energy Agency’s (IEA) New Policies Scenario, the global energy demand is expected to grow by 30% between 2015 and 2040,
Floating liquefied natural gas (FLNG) technology is complementary to conventional onshore liquefied natural gas (LNG) as it helps accelerate the development of gas resources to meet the world’s growing demand.
FLNG technology makes the production, liquefaction and storage of natural gas possible at the sea. LNG is transferred directly from the floating facility to specific carriers, for convenient shipping to countries around the world.
Natural gas is produced from underwater fields then processed and chilled to -162° Celsius (-260° Fahrenheit). This shrinks its volume by 600 times to create LNG. The advanced design of an FLNG facility packs a typical land-based LNG plant into a fraction of its normal size.
An example of this technology currently being developed is Shell’s FLNG, Prelude:
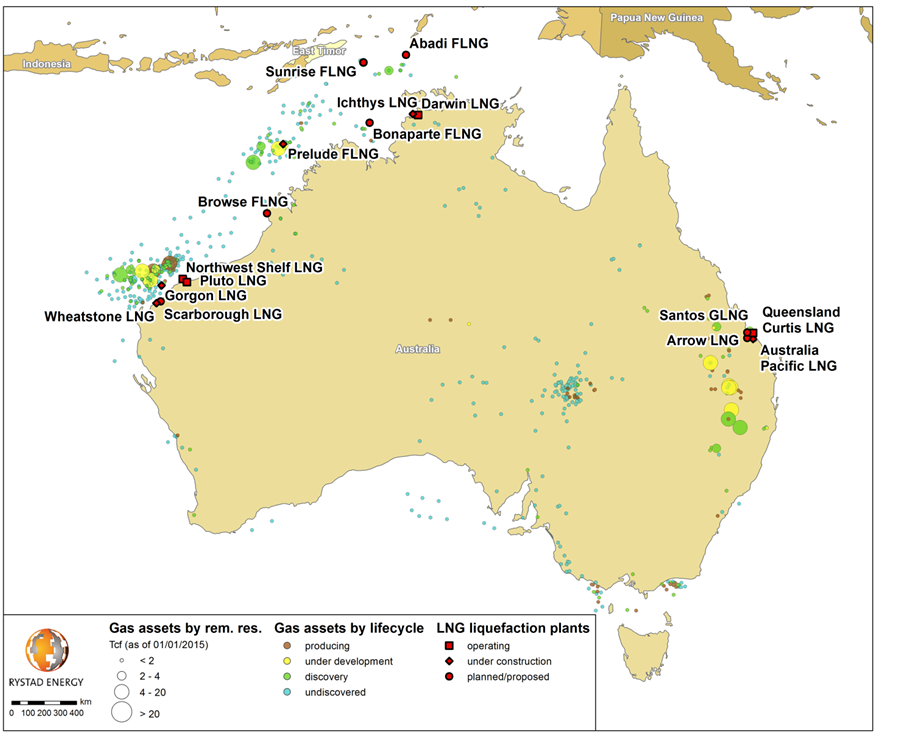
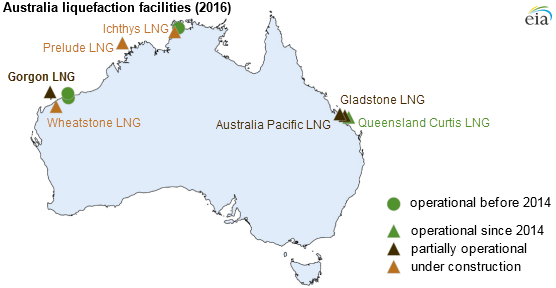
Shell corporation is taking great strides towards delivering the Prelude FLNG facility. Prelude is now on location, 475 km (295 miles) north, north-east of Broome, Western Australia.
Once operational, Prelude FLNG will produce 3.6 million tonnes per annum (mtpa) of LNG, 1.3 mtpa of condensate and 0.4 mtpa of LPG.
Prelude is designed to remain in place in severe weather conditions and even withstand a 1-in-10,000-year storm.
The Prelude facility is designed to remain at the sea for around 25 years. It will be moored in the Browse Basin off the north-west coast of Australia, in about 250 metres of water. FLNG facilities can be re-deployed to develop new gas fields.
FLNG technology offers countries a more environmentally-sensitive way to develop natural gas resources. Prelude will have a much smaller environmental footprint than land-based LNG plants, which require major infrastructure works. It also eliminates the need for long pipelines to land.
Location: Browse Basin, Australia
Depth: ~250 metres
Category: Floating liquefied natural gas
Interest: Shell 67.5%, INPEX 17.5%, CPC 5%, KOGAS 10%
Fields: Prelude and potentially other Shell natural gas assets in the region
FLNG facility production capacity: At least 5.3 million tonnes per annum (mtpa) of liquids: 3.6 mtpa of LNG, 1.3 mtpa of condensate and 0.4 mtpa of liquefied petroleum gas
Numbers about the Prelude FLNG of SHELL:
600 engineers worked on the facility’s design options.
200 km (125 miles) is the distance from the Prelude field to the nearest land.
4 soccer fields, laid end to end, would be shorter than the facility’s deck.
175 Olympic-sized swimming pools could hold the same amount of liquid as the facility’s storage tanks.
6,700 horsepower thrusters will be used to position the facility.
50 million litres of cold water will be drawn from the ocean every hour to help cool the natural gas.
6 of the largest aircraft carriers would displace the same amount of water as the facility.
93 metres (305 feet) is the height of the turret that runs through the facility, secured to the seabed by mooring lines.
-162° Celsius (-260° Fahrenheit) is the temperature at which natural gas turns into LNG.
1/600 is the factor by which a volume of natural gas shrinks when it is turned into LNG.
117% of Hong Kong’s annual natural gas demand could be met by the facility’s annual LNG production.
20-25 years is the time the Prelude FLNG facility will stay at the location to develop gas fields.
The LNG Timeline
- British chemist Michael Faraday was the first to experiment with the liquefaction of natural gas.
- In 1883, two professors from the Jagiellonian University – Zygmunt Wróblewski and Karol Olszewski – managed to liquefy oxygen and nitrogen from atmospheric air. However, cooling and liquefaction technologies that can be implemented in cooling equipment were patented in 1896 by a German engineer and entrepreneur Karl Paul Gottfried von Linde, who in 1873 constructed the first cooling equipment in Europe.
- The first cooler in the world appeared in Australia and was designed and built by a Scotsman – James Harrisson, printer and journalist by profession. The original technological concept served to cool the air and was put into use for the first time in the foods sector.
- 1912: First experimental plant designed to store LNG (Virginia, USA).
- 1941: First commercial liquefaction facility was constructed in Cleveland, Ohio (USA) in 1941.
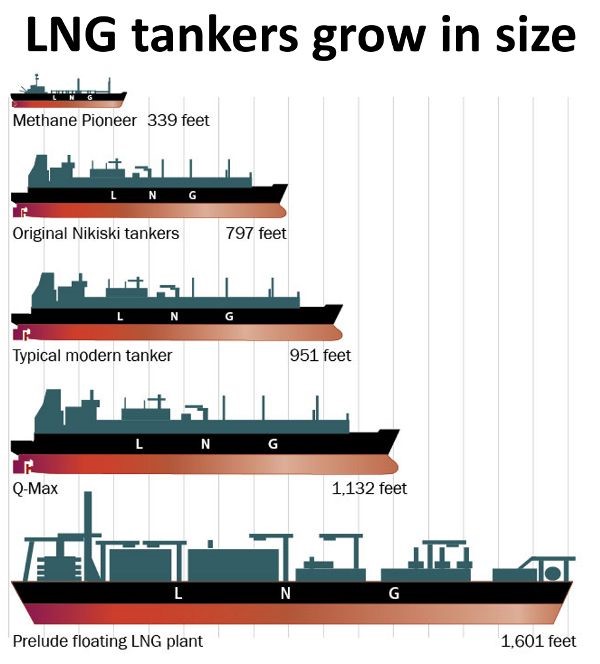
- 1959: The first transport of Liquefied Natural Gas took place after the Second World War. In January 1959, “The Methane Pioneer”, an adapted transporter ship that was used in the Second World War, sailed out of Lake Charles in Louisiana (USA) with a load including LNG, in order to reach its destination – Canvey Island in Great Britain.
- After the first and subsequent seven successful transports of LNG via ships, the British Gas Council decided to import LNG from Venezuela. However, in connection with the discovery of deposits in Libya and Algeria, countries located much nearer Great Britain than Venezuela it was ultimately decided to import LNG from Algeria, which thus became the first exporter of LNG in the world. The first commercial delivery of LNG from Algeria to the British market took place in 1964. LNG supplies to Great Britain did not withstand the competition with deposits discovered in the North Sea.
- 1964: First commercial shipment of Algerian LNG to UK and France. The Algerian plant of Arzew was the first high-capacity liquefaction terminal.
- 1969: Further exchanges took place between Algeria and France, Libya and Italy, and Spain and Cook Bay in Japan (this was the first project in the Pacific area).
- 1969: First imports of LNG into Asia (today the premier market for LNG imports) commenced in 1969 when Tokyo Electric and Tokyo Gas started purchasing LNG from Alaska.
- 1972-1978: The US joins the LNG market, introducing four regasification plants.
- 1973: First LNG import operations from Brunei to Japan; the Pacific area starts playing an important role when Korea and Taiwan join in as importing countries.
- The 70’s and 80’s brought a heightened interest in LNG. In Asian countries, mainly Japan and Korea, the construction of power plants was commenced which were intended to be fuelled by natural gas. This significantly contributed to better conditions for harnessing LNG.
- The 90’s: Rise of the Atlantic area markets (Europe, North America).
- 2000: The market for LNG grows exponentially. Between 2000 and 2011 the annual average growth is equal to 7.5%, outdoing 300 billion of cubic meters (gaseous state).
- 2008: The largest LNG carrier is called the Mozah, with a capacity of 266,000 cubic meters. Built by South Korean Samsung Heavy Industries for Qatargas and Nakilat, Mozah is the first of 14 Q-Max ships developed after the 216,000-cubic-meter Q-Flex, and used to transport LNG from Qatar to Europe and from the US to the Far East.
- 2013: Approaching 75% of the world’s imports, Asia’s demand for LNG continues to grow.
- 2014: The LNG global market celebrates 50 years of history with about 80,000 transfers without significant accidents.

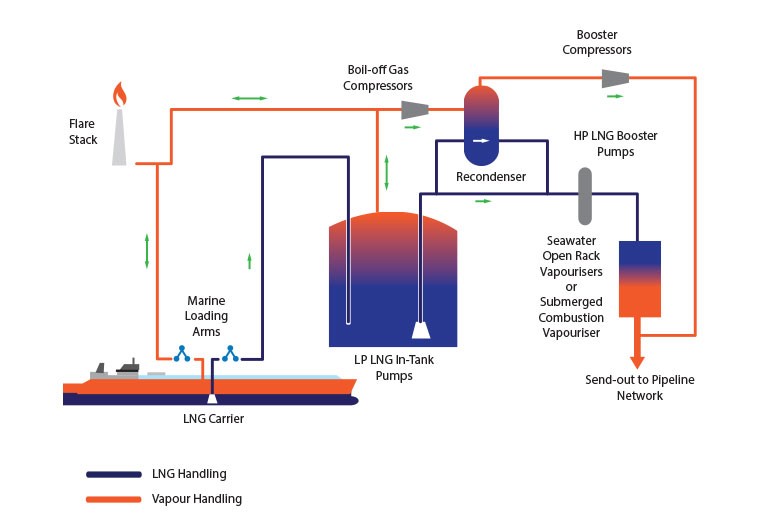
The Re-gasification of LNG
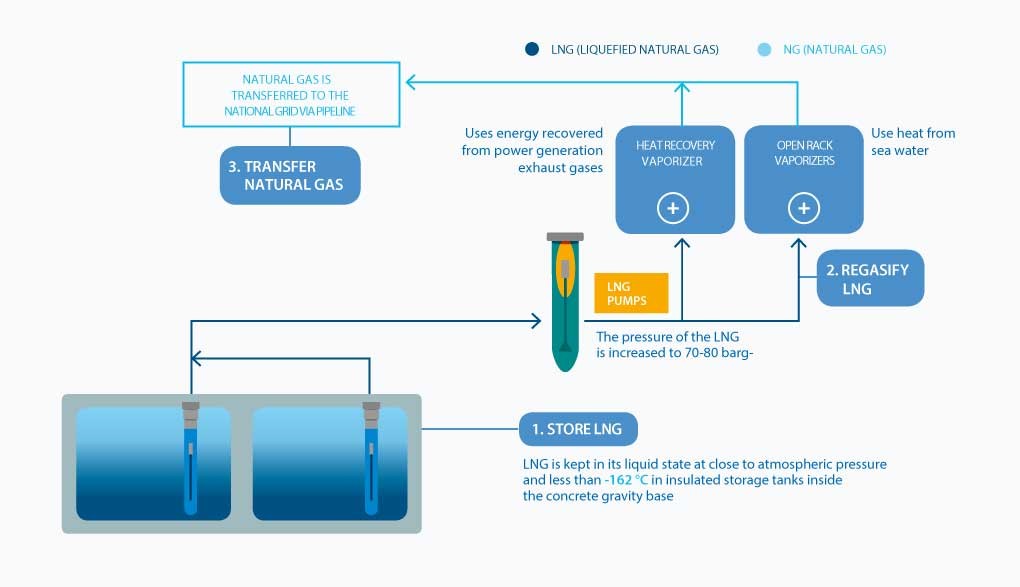
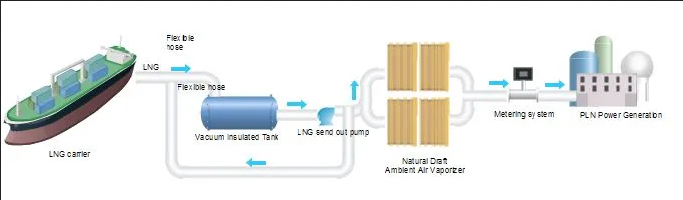
The re-gasification of LNG consists in returning the gas from its liquefied state to its gas state by heating the liquefied raw material. Evaporators of various output volumes, constructions and heating methods are the basic equipment used in the LNG re-gasification facility.
The location of gas deposits throughout the world in places which are difficult to connect using pipelines with countries, who are the chief recipients of that gas, also has a vast significance on the increasing interest in LNG. The use of liquefied natural gas is also an excellent method for covering the peak demands for gas.
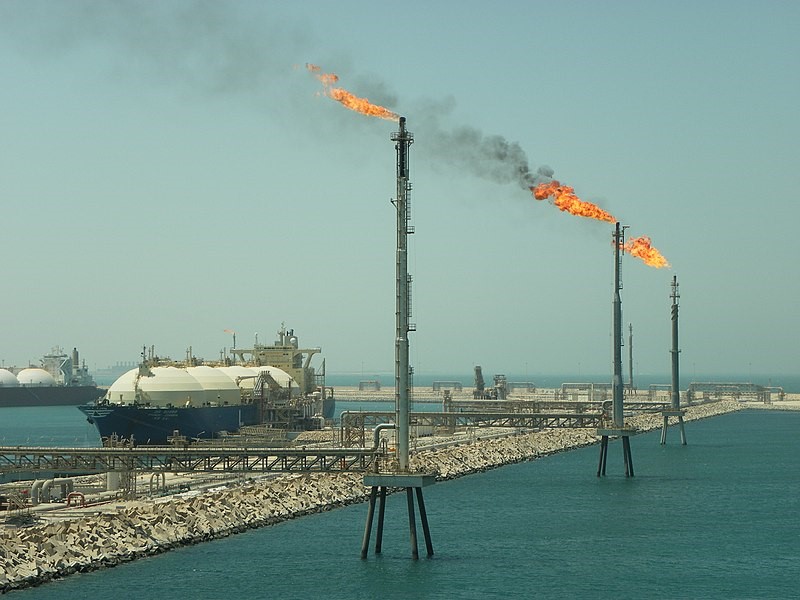
Ras Laffan Industrial City
As an industrial city, Ras Laffan commissioned its activities in 1996. The purpose of this city’s founding was to host petrochemical facilities for the natural gas obtained North Field. The North Field, found in 1971, is the world’s largest natural gas field, occupying an offshore area of roughly 6,000 square km; more than half the size of the State of Qatar. North Field contains over 900 tcsf (trillion cubic standard feet) of recoverable gas.
Ras Laffan Industrial City is Qatar’s main site for the production of liquefied natural gas and gas-to-liquid.
LNG Tanker History
In January 1959 Methane Pioneer, a converted World War II freighter containing five aluminium prismatic tanks, carried a liquefied natural gas cargo from Lake Charles, La., to Canvey Island, United Kingdom. This demonstrated that the transportation of large quantities of LNG safely across the ocean was possible. By the turn of the century this industry employed more than $200 billion in capital.
The LNG industry started in 1964 with the first shipments from Algeria to the UK. By the late 1990s (the intervening years) international trade in LNG increased 50-fold, production capacity 10-fold and the transport capacity of individual ships 5-fold. The first gas carrier tanks that were used in a continuous regular trade in the United States were of the membrane tank design. In 1965 Phillips Petroleum contacted the Coast Guard concerning a proposal that the energy company had made to Tokyo Gas for shipping LNG from Alaska. The shipments were to be made in tanks that were designed by Worms and Co., Paris, France. This design later became known as the Gaz Transport design. At first, the LNG carriers were envisioned as being 34,000 cubic meters, but eventually the design called for the 71,500 cubic meter vessels that became the Arctic Tokyo and Polar Alaska.
Höegh built the world’s first LNG carrier with spherical tanks in 1973. Norman Lady was delivered in November 1973, from the Rosenberg shipyard in Norway. The vessel was the prototype of the Moss spherical cargo containment system. Leif Höegh & Co. took an active role in the development of this system.
In 1999 Samsung Heavy Ind. successfully constructed the world’s largest New Membrane-type LNG carrier, which was the largest single hull-form vessel in the world at that time. Lighter and faster than the existing LNG vessels, it had a price equivalent to 10 freighters ($220 million).
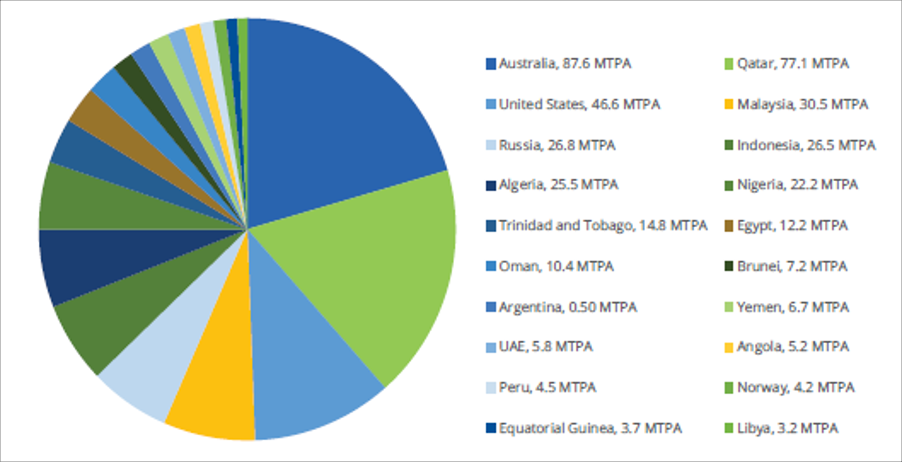
The Global Liquefaction Capacity
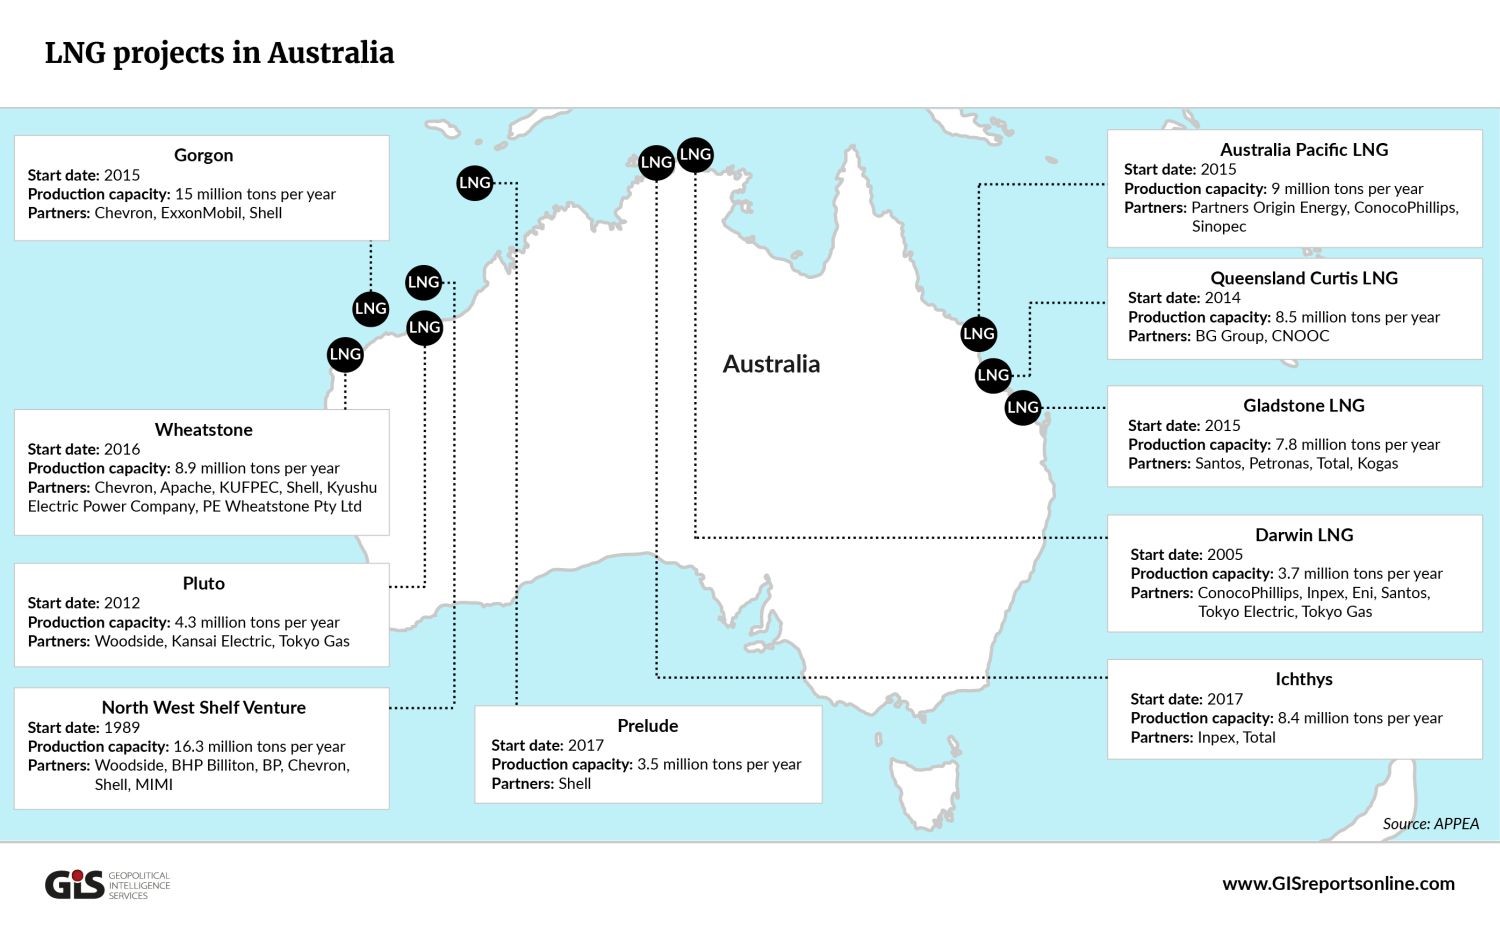
These figures shows that half of the world’s LNG capacity is concentrated in Australia, Qatar, and the USA in 2019.
Liquefaction Projects
The fact is that LNG plants are expensive to construct. Extreme examples of this are the Gorgon project in Australia with a total capital cost of $53 billion (three trains and a total LNG capacity of 15,6 million tpa) and the Yamal project in Russia with a total capital cost of $27 billion (three trains and a total capacity of 16,6 million tpa). Even smaller expansion projects such as Bintulu train 9 with a capacity of 3,6 million tpa (third party access) carries a price tag of $2,5 billion.
Small-scale LNG plants (roughly classified as capacities below 500,000 (tpa) are constructed in increasing numbers. Even micro-scale LNG plants (capacities below 50,000 tpa) are constructed in specific circumstances, such as treatment of biogas from waste-dumps (where capacities as low as 5,000 tpa are used). These smaller LNG plants are often modularised skid-mounted units.
According to IGU (2020), more than 40 large LNG plants (capacity over 1 million tpa) were operating at the end of 2019. Most of these plants had multiple trains with Qatar gas and Ragas in Qatar now both up to seven trains each. Four of these facilities are FLNGs. In 2014, there were close to 100 small-scale LNG facilities operating with a total capacity of approximately 20 million tpa. The exact current number of small-scale facilities is unknown but is expected to be approximately 150.
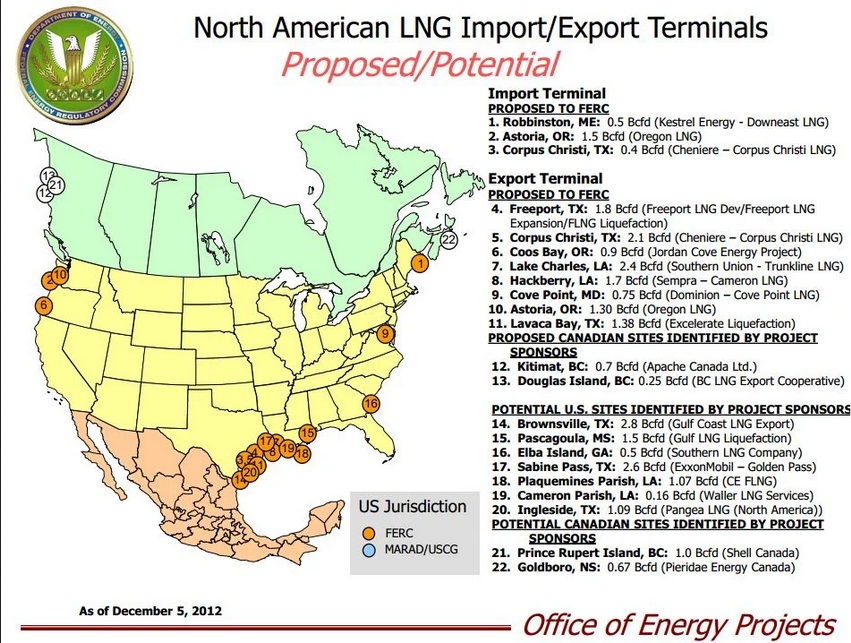
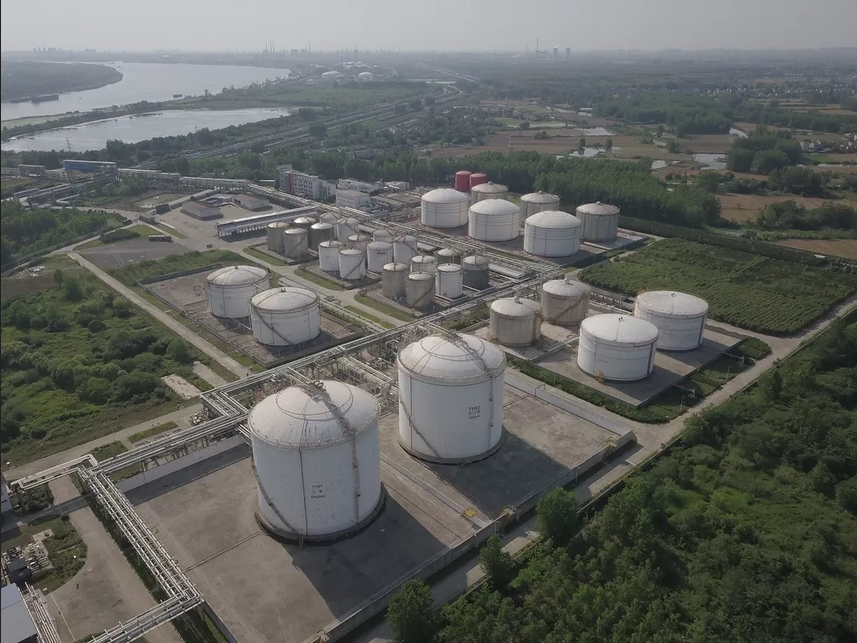
LNG Terminals
LNG port terminals are purpose-built port terminals designed to accommodate large LNG carrier ships designed to load, carry and unload LNG. These LNG terminals are located adjacent to a gas liquefaction and storage plant (export), or to a gas regasification and storage plant (import), which are themselves connected to gas pipelines connected to on-shore or off-shore gas fields (export) or to storage and distribution plants (import).
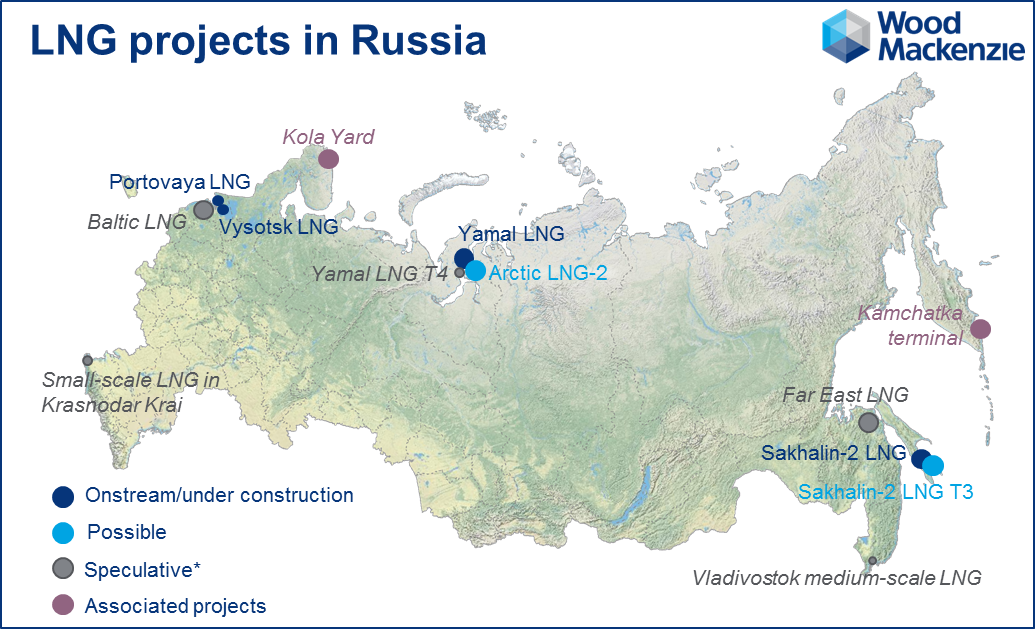
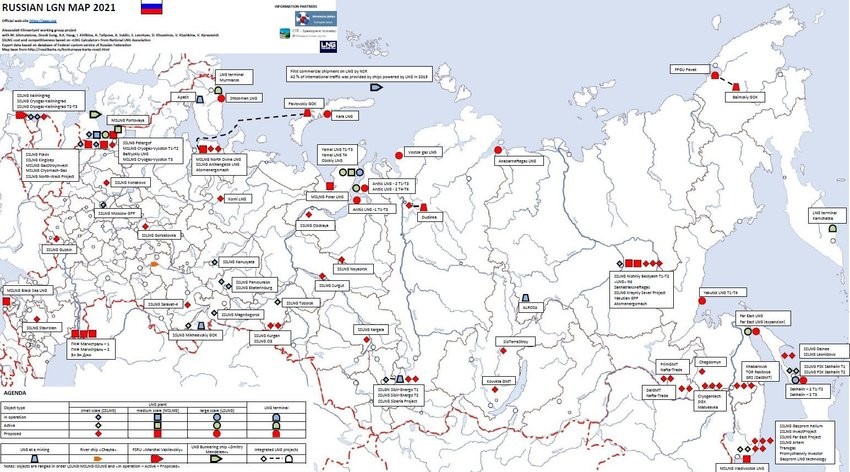
We represent some examples of liquefaction terminals in various countries here, although this is not the whole list of world LNG terminals: Russia
- Sakhalin LNG, Sakhalin, Russia – (Sakhalin Energy Investment Company Ltd.)
- Yamal LNG, in Sabetta, on the Yamal Peninsula, in Russia.
South America
- Peru LNG, Pampa Melchorita, Peru
- Tango FLNG, Argentina, 2019
- Atlantic LNG, Trinidad and Tobago
- North AmericaKenai LNG, Nikiski, Alaska
- Cheniere Energy Sabine Pass terminal (Louisiana)
- Dominion Cove Point LNG, Maryland terminal
- Cheniere Energy Corpus Christi terminal, Texas
- Freeport LNG Terminal, Quintana Island, Texas
- Cameron LNG, Hackberry, Louisiana
- Southern LNG, Elba Island, Georgia – (Kinder Morgan) (under construction)
- Costa Azul LNG near Ensenada, Baja California, Mexico
- Solensa (small-scale) near Monterrey, Mexico
Examples of regasification terminals in various countries:
Chile, GNL, Quintero
- GNL, Mejillones
India
- Konkan LNG Private Limited, Dabhol, Maharashtra, 5 million tonnes per year.
- Dahej Terminal, Petronet LNG Ltd., Gujarat – 15 million tonnes per year and 17.5 million tonnes per year by the end of 2018.
- Hazira Terminal, Shell Ltd., Gujarat – 5 million tonnes per year
- Kochi Terminal, Petronet LNG Ltd. – 5 million tonnes per year
- Mundra Terminal, GSPC LNG Ltd. – 5 million tonnes per year
- Chennai Terminal, INDIAN OIL LNG (joint venture of Indian Oil Corporation) – 5 million tonnes per year
- UKSouth Hook LNG, Milford Haven, South Wales
- Dragon LNG terminal, Milford Haven, South Wales
- Grain LNG, Isle of Grain, Kent
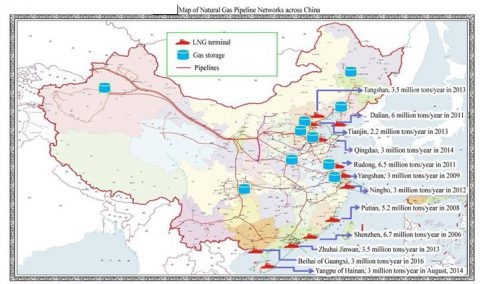
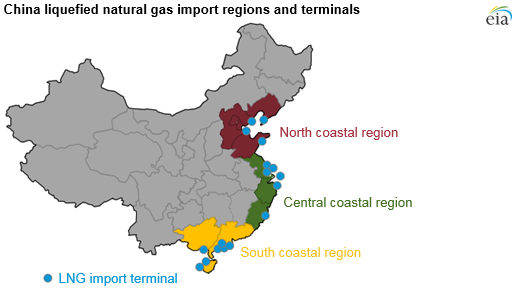
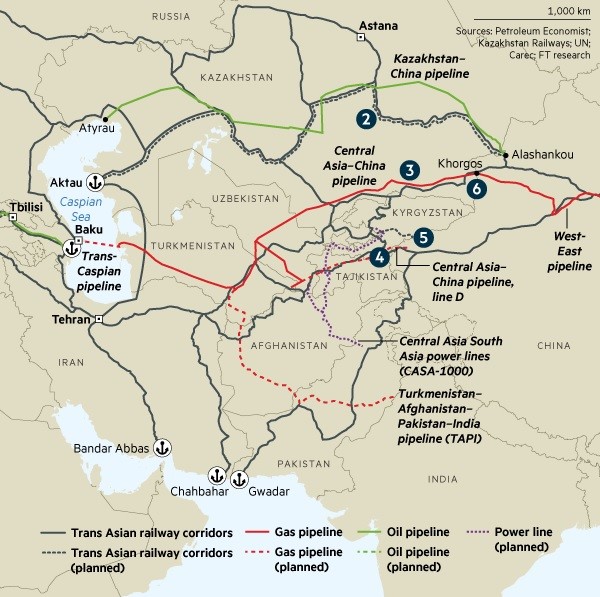
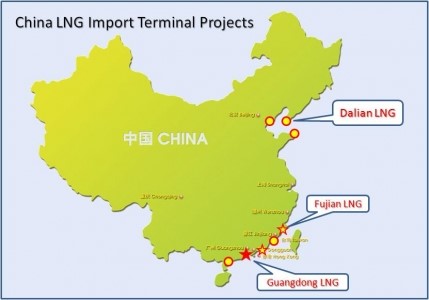
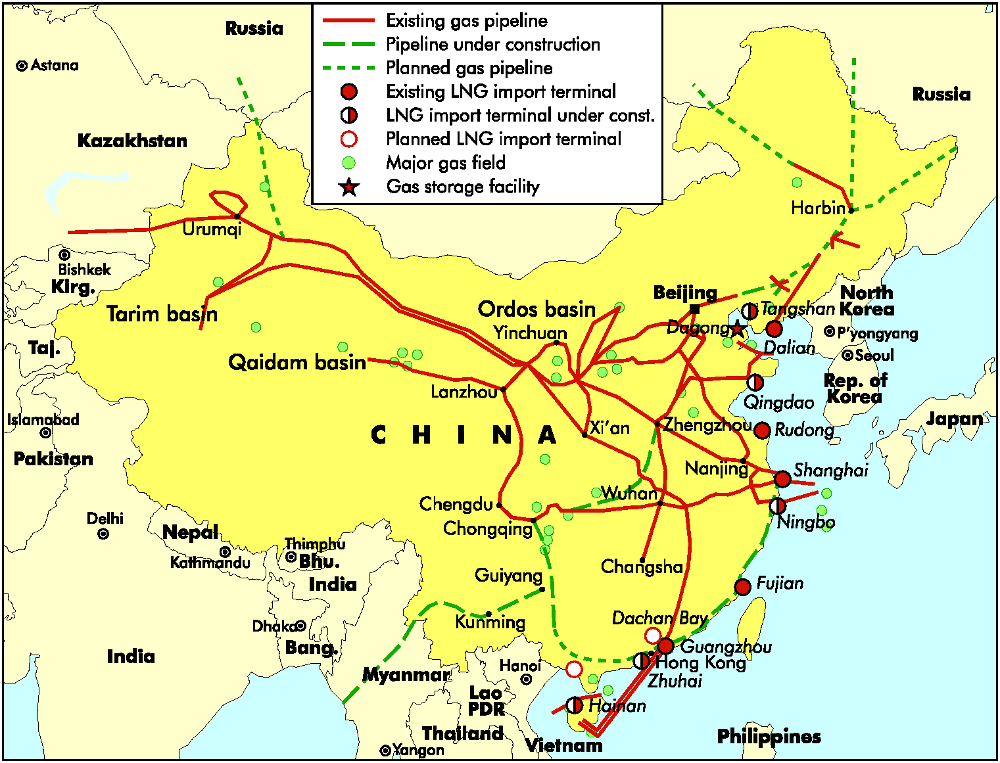
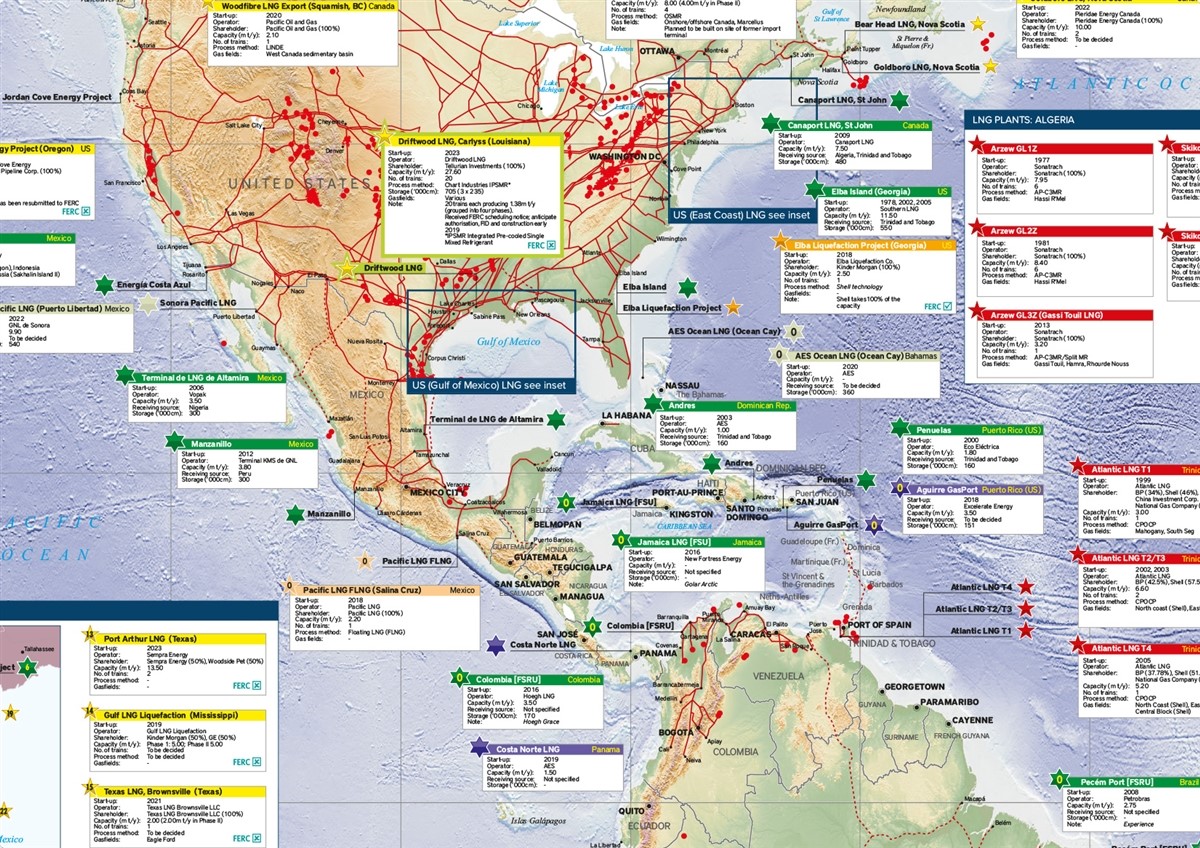
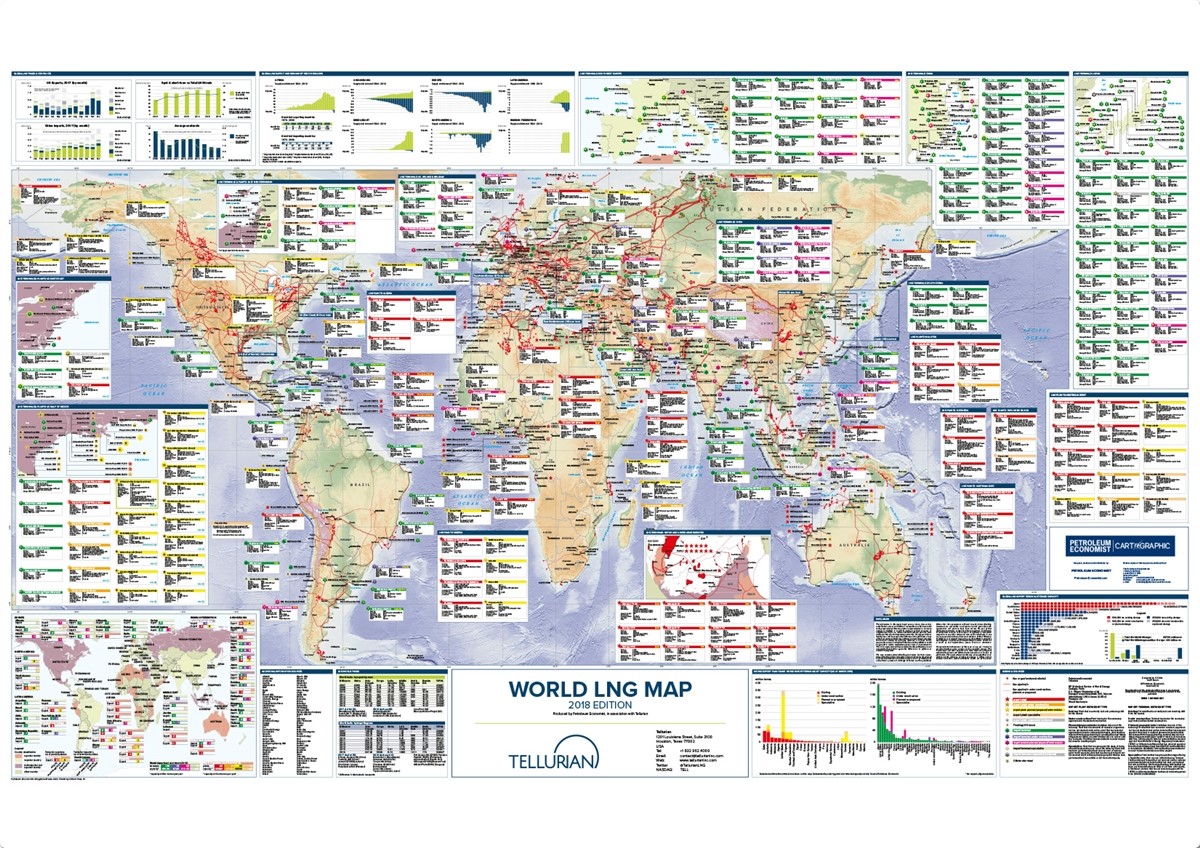
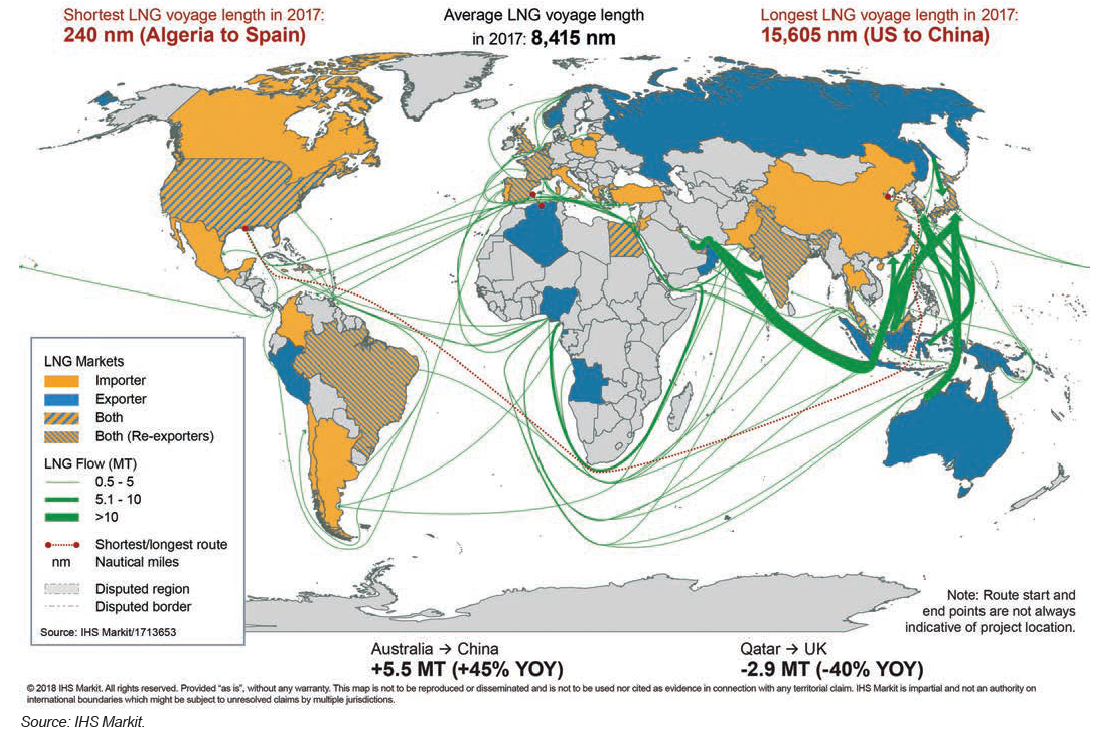
- Maps of LNG Transportation Routes and Terminals of Different Countries in the World
The World Overviews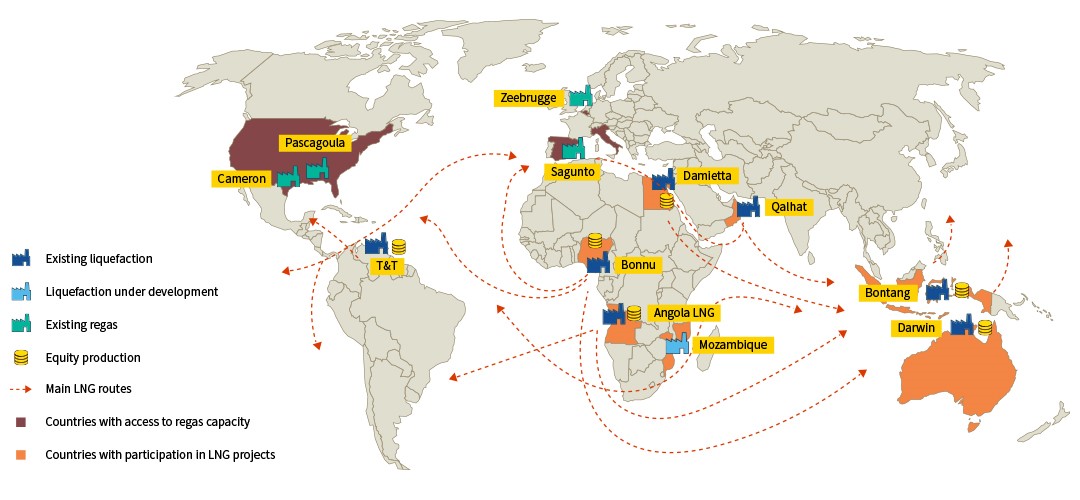


We Answer Your Questions